DB File Sequential Read wait event is High on Oracle Database - Performance Engineering to Find out where is Bottleneck?
Found one interesting problem during performance testing , wanted
to share here.
Observed there is a drop on server throughput, Correlated Load
runner Throughput graph with Average Response time graph:
From the above Graph for the first 25mins ART was so high and that time throughput was low , after that both the graphs are stable.
So what happened on first 25mins of the load test , Lets go and do some analysis on server.
So we should start checking the servers ( web/app/DB ) to find out where is the problem , most likely throughput related issues occurs from DB side , lets start investigating from Data base server first.
Started checking with Database first
and observed there is a high user I/O
activity during high response time (low throughput).
So from OEM console, observed high user I/O.
So we can see the problematic SQL, which is making high User I/O.
So click on above SQL ID and see what event is making this high user I/O ( so by now at least we know which SQL is the culprit)
So above graph shows DB file sequential read event is more , so get either AWR or ADDM report or Talk to DBA to know why this is so high?
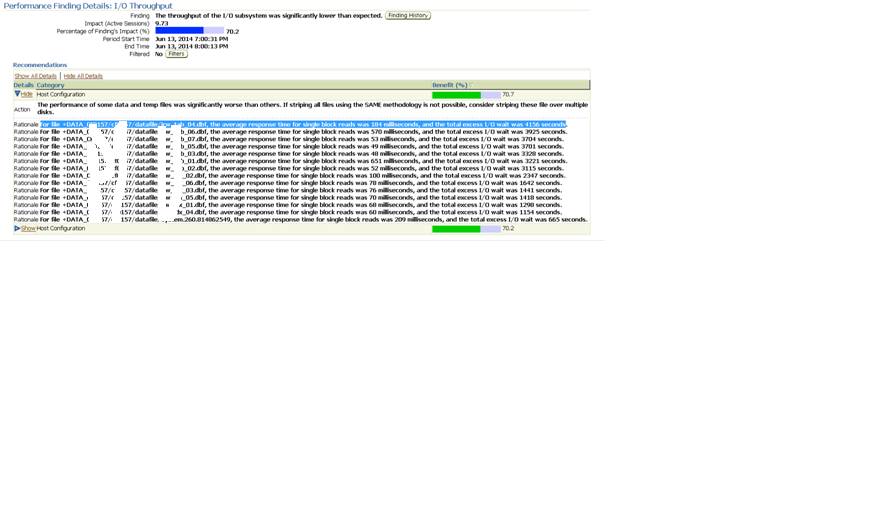
So when I generate ADDM report for Oracle recommendations below is what I got.
The
performance of some data and temp files was significantly worse than others. If
striping all files using the SAME methodology is not possible, consider
striping these file over multiple disks.
For
file +DATA_XXXXXXXX/datafile/XXXX_tab_04.dbf, the average response time for
single block reads was 184 milliseconds,
and the total excess I/O wait was 4156
seconds.
Below would the mitigations we can follow to overcome this
issue:
DB File Sequential Read wait event occurs when we are trying to access
data using index and oracle is waiting for the read of index block from disk to
buffer cache to complete. A sequential read is a single-block read.Single
block I/Os are usually the result of using indexes. Rarely, full table scan
calls could get truncated to a single block call due to extent boundaries, or
buffers already present in the buffer cache.Db file sequential read wait events
may also appear when undo blocks are read from disk in order to provide a
consistent get(rarely).
To determine the actual object being waited can be checked by
the p1, p2, p3 info in v$session_wait . A sequential read is usually a
single-block read, although it is possible to see sequential reads for more
than one block (See P3). This wait may also be seen for reads from datafile
headers (P2 indicates a file header read) ,where p1,p2 and p3 gives the the absolute
file number ,the block being read ,and the number of blocks (i.e, P3
should be 1) respectively.
Block reads are fairly inevitable so the aim should be to
minimise un-necessary IO. This is best achieved by good application design and
efficient execution plans. Changes to execution plans can yield orders of
magnitude changes in performance.Hence to reduce this wait event follow the
below points .
1.) Tune Oracle - tuning SQL statements to reduce unnecessary I/O request is the only guaranteed way to reduce "db file sequential read" wait time.
2.) Tune Physical Devices - Distribute(stripe) the data on diferent disk to reduce the i/o . Logical distribution is useless. "Physical" I/O performance is only governed by "independency of devices".
3.) Faster Disk - Buy the faster disk to reduce the unnecessary I/O request .
4.) Increase db_block_buffers - A larger buffer cache can (not will, "might") help.


No comments:
Post a Comment