Monday, November 11, 2019


This article expains about how to test API’s using web_rest function and also how to modify JSON resonses


1.      Web_rest() function will be used for creating GET/POST/DELETE/PUT/etc… , so insert this function and add end points including headers and body

Example:
web_rest("OneEmployeeDetails",
        "URL=http://dummy.restapiexample.com/api/v1/employee/1",
        "Method=GET",
        "Snapshot=t20084.inf",
        LAST);

2.      Get the response from the result of web_rest and play with response based on your needs , some of the useful examples are given below
3.      Before checking the scripts , few online tools needed to making JSON path and also beatification

http://jsonpathfinder.com/   -- This helps to make JSON path , which can be used directly in QueryString in lr_json_XXXX functions.
https://jsonpath.com/  -- This helps to check the json expression is correctly retrieving the outputs so that that expression can be used in functions
https://jsonformatter.curiousconcept.com/  -- This helps to validate JSON


Action()
{
    // This script helps for handling JSON data in HP Load runner
    // Get, Insert, delete , Post , etc ... 
    // Web_rest is the function we use for testing REST API's / Micro services / web services
   
   
    // Example1: 
    int i=0;
   
 web_reg_save_param_ex(
    "ParamName=Output",
    "LB=",
    "RB=",
    SEARCH_FILTERS,
    "Scope=Body",
    LAST);
   
   
    web_rest("OneEmployeeDetails",
        "URL=http://dummy.restapiexample.com/api/v1/employee/1",
        "Method=GET",
        "Snapshot=t20084.inf",
        LAST);

    lr_eval_json ("Buffer={Output}""JsonObject=JSON_Param");
   
       //indented
    lr_json_stringify("JsonObject=JSON_Param","Format=indented","OutputParam=Result",LAST );
    lr_output_message("Indented JSON is : %s"lr_eval_string("{Result}"));
   
   
    //lr_output_message("OUTPUT is::::: %s",lr_eval_string("{Output}"));
   
   
        // Load JSON
    lr_eval_json("Buffer={Output}","JsonObject=json_obj",LAST);   
   
   
       // Get values from the json
    lr_json_get_values("JsonObject=json_obj",
                       "ValueParam=sal_BeforeUpdate",
                       "QueryString=$.employee_salary",
                       //"SelectAll=Yes",
                       LAST);
      
       lr_json_stringify("JsonObject=json_obj","Format=indented","OutputParam=Result",LAST );
      lr_output_message("Indented JSON is : %s"lr_eval_string("{Result}"));
   
      
    // Print the output of QueryString
   //lr_output_message("Employee Sal :::: %s",lr_eval_string("{sal_BeforeUpdate}"));
  
  
   lr_save_string("\"isbn\": \"0-048-08048-9\"""i_new_isbn");
  
   lr_eval_json("Buffer={i_new_isbn}",
                 "JsonObject=i_json_obj2"LAST);
   
    i = lr_json_insert("JsonObject=json_obj",
                       "JsonNode=i_json_obj2",
                       "QueryString=$.*",
                       LAST);
   // Json Insert Operation
  
//   // 1 match
//    i = lr_json_insert("JsonObject=json_obj",
//                    "Value=",
//                    "QueryString=$.",
//                     LAST);    
    if (i != 1)
        lr_error_message("lr_json_insert should return %d, but returns %d"1, i);
    else
        lr_error_message("lr_json_insert should return %d, it returns correctly %d"1, i);
   
         lr_json_get_values("JsonObject=json_obj",
                       "ValueParam=store_val_afterJAYA",
                       "QueryString=$.*",
                       //"SelectAll=Yes",
                       LAST);
  
   lr_output_message("Store List After Jaya krishna insert:::: %s",lr_eval_string("{store_val_afterJAYA}"));


    Example2:
    
    int i=0,a=0;
    char* json_input = "{\n    \"store\": {\n        \"book\": [\n            {\n                \"category\": \"reference\",\n                \"author\": \"Nigel Rees\",\n                \"title\": \"Sayings of the Century\",\n                \"price\": 8.95\n            },\n            {\n                \"category\": \"fiction\",\n                \"author\": \"Evelyn Waugh\",\n                \"title\": \"Sword of Honour\",\n                \"price\": 12.99\n            },\n            {\n                \"category\": \"fiction\",\n                \"author\": \"Herman Melville\",\n                \"title\": \"Moby **bleep**\",\n                \"isbn\": \"0-553-21311-3\",\n                \"price\": 8.99\n            },\n            {\n                \"category\": \"fiction\",\n                \"author\": \"J. R. R. Tolkien\",\n                \"title\": \"The Lord of the Rings\",\n                \"isbn\": \"0-395-19395-8\",\n                \"price\": 22.99\n            }\n        ],\n        \"bicycle\": {\n            \"color\": \"red\",\n            \"price\": 19.95\n        }\n    }\n}";
    //char* json_output;
    lr_save_string(json_input, "JSON_Input_Param");
    
    lr_output_message("some text is: %s",json_input);


    // Load JSON
    lr_eval_json("Buffer={JSON_Input_Param}","JsonObject=json_obj",LAST);    
    
    lr_json_get_values("JsonObject=json_obj",
                       "ValueParam=store_val_Before",
                       "QueryString=$.store",
                       //"SelectAll=Yes",
                       LAST);
   
   lr_output_message("Store List Before:::: %s",lr_eval_string("{store_val_Before}"));

    // Save result in parameter "title"
  lr_json_get_values("JsonObject=json_obj",
                       "ValueParam=title_val",
                       "QueryString=$.store.book[0].title",
                       //"SelectAll=Yes",
                       LAST);

   // lr_save_string(json_output, "title_val");
    
   lr_output_message("Output of JsonExperssions %s",lr_eval_string("{title_val}"));
   
   lr_json_delete("JsonObject=json_obj",
               "QueryString=$.store.bicycle",
               LAST);
   
   
    lr_json_get_values("JsonObject=json_obj",
                       "ValueParam=store_val_after",
                       "QueryString=$.store",
                       //"SelectAll=Yes",
                       LAST);
   
   lr_output_message("Store List After:::: %s",lr_eval_string("{store_val_after}"));


   // 1 match
    i = lr_json_insert("JsonObject=json_obj",
                    "Value={\"owner\":\"Mr Black\"}",
                    "QueryString=$.store",
                     LAST);    
    if (i != 1)
        lr_error_message("lr_json_insert should return %d, but returns %d", 1, i);
    else 
        lr_error_message("lr_json_insert should return %d, it returns correctly %d", 1, i);
    
         lr_json_get_values("JsonObject=json_obj",
                       "ValueParam=store_val_afterJAYA",
                       "QueryString=$.store",
                       //"SelectAll=Yes",
                       LAST);
   
   lr_output_message("Store List After Jaya krishna insert:::: %s",lr_eval_string("{store_val_afterJAYA}"));
    
   
   // 2 match with ValueParam and SelectAll=Yes
    lr_save_string("{\"discount\":\"20 percent\"}", "i_new_discount");
    
    a = lr_json_insert("JsonObject=json_obj",
                       "ValueParam=i_new_discount",
                       "QueryString=$.store.book[?(@.price > 10)]",
                       "SelectAll=Yes",
                       LAST);
    
     lr_json_get_values("JsonObject=json_obj",
                       "ValueParam=store_val_afterJAYA1",
                       "QueryString=$.store",
                       //"SelectAll=Yes",
                       LAST);
   
   lr_output_message("Store List After Jaya krishna insert:::: %s",lr_eval_string("{store_val_afterJAYA1}"));


    return 0;
}

Friday, February 15, 2019

How to generate Nmon Report:


nmon -s 30 -c 150 -t -f


150 samples

every 30 seconds 1 sample

so this works for load test which runs for 1.5 runs

after getting the .nmon file , uploaded it to IBM nmon analyer and get the XL report

Tuesday, January 8, 2019


How to handle Load runner Dynamic values print all of them


Action()
{
   
    int i;
int ncount;
char ParamName[1000];


    web_reg_save_param("URLList","LB=<a data-container-link href=\"","RB=\" target=\"\">","search=All","ord=all",LAST);
   
   
    web_set_sockets_option("SSL_VERSION""TLS");
   
    web_url("MicroSites",

    "URL=https://HostName/{URL}",

    "TargetFrame=",

    //"TargetBrowser=Mercury Technologies",

    "Resource=0",

    "RecContentType=text/html",

    "Snapshot=t1.inf",

    "Mode=HTML",

    LAST );
   
   
    ncount= atoi(lr_eval_string("{URLList_count}"));

    for (i =1;i <= ncount;i++)
       {
    sprintf(ParamName, "{URLList_%d}", i);

       lr_output_message("Value of %s: %s",ParamName,lr_eval_string(ParamName));
           }
   
    //lr_output_message("Working Microsites are# %s",lr_eval_string("{URLList}"));
   
    return 0;
}

Tuesday, December 2, 2014

Performance Testing-Questionnaire

Identify the Performance Test Environment

1) Which environment PT is being conducted?
2) Provide Logical and physical production architecture of PROD and Pre-PROD
(Hardware and Software) configurations like CPU,Memory Details
3) is PT Environment being shared with any other apps?
4) Scheduled jobs running on PT Environment if yes when ?
5) which/what type of application server/Web server /Database server/Cache server/Load Balencers used?
6) Is database is shared across any other applications?
7) How scallable PT enviorment compare to LIVE? 50% , 70% ?
1) Provide an access to all application server/Web server /Database server/Cache server/Load Balencers 
2) Make sure Application will be able to access from All Load Inject machines
3) Make sure Monitoring is enabled in all servers ( like vmstat,IO stat, etc..) install utilities if required ( if there is no dedicated monitoring tools like wily,Dyna trace, New relic, Site scope, etc..)
4) Are the PT environments scalable to live? How much? 
5) Make sure access has been given to  server log locations for checking log entries during load/stress/soak testing ( Debugging purpose)

Identify the application level Info

1) Provide an application overview ( sub systems/Dependencies )
2) Provide key business scenarios of application ( flows which requires testing like most resource intensive calls to DB/App, Key business impacting scenarios like creation of orders , frequently used flows by users , etc..)
3) What is the protocol between client and server?
4)What are the interfaces of the application? e.g., Payment gateways, web services etc.,
5) Client browser version dependent? If any

Load Generation Tool Info

1) Which tool is being used for Performance testing?
2) Do we have required Licences for conducting PT? like Number of LG's required, Number of concurrent users, Protocols support, etc..

Monitoring Tools Info

1) Which monitoring tools are using?
2) Requried counters are settup to monitor all metrics ( like CPU,Memory, Disk I/O,Network,Application level metrics )

Profiling Tools Info

1) which tool is being used for Profiling? If we have any?
2) What level of probing is done? 
3) Which counters are required to monitor like GC Heap, threads, Connection pools,etc
4) Database sepecific metrics ( Slow SQL's , Execution plans, SQL details )
5) Do we have DB specific monitoring tools like OEM, SQL Monitors ?

Identify Performance Acceptance Criteria

1) Average Transaction Response times
2) 90% percental values If we have any target
3) Throughput / TPS
4) Resource utilization for all servers ( CPU,memory, disk input/output (I/O), and network I/O) ( Web/App/DB)
5) List of NFR's for current release
6) Load volumes ( number of concurrent users )
7) Load Distributions ( %of load across identified business scenarios )
8) What are the known current as well as previous performance bottlenecks?  ( like Memory leaks/High response times , etc )
9) Type of Performance tests required based on NFRs provided like..
Load Test
Stress Test
Endurence Test
Spike Test , etc…

Test Data

1) Who will provide required test data for PT
2) Do we have SQL's in place to mine the test data from database
3) Do we have Necessary privileges to execute the SQL’s  to generate the test data?
4) Do we gather stats regularly?

General Information

1) What is the current project timeline to begin and close testing activities?
2) Scheduled timelines for PAT
3)Is the application functionality stable and its functional testing is completed?
4)Please provide access credentials/URL of the application?
5)What are the goals of the performance testing activity? Why we are planned to do?
6)Do we have baselines ?
7)Who are the end users of the system?

Wednesday, August 20, 2014

 During Performance Testing using HP Load Runner , you will find the below terms.This Post will be useful for the PT new learners.

  
Load Runner Objects:

Vuser Scripts
A Vuser script describes the actions that a Vuser performs during the scenario. Each Vuser executes a Vuser script during a scenario
Run. The Vuser scripts include functions that measure and record the performance of your application components

Load Test

Tests a system's ability to handle a heavy workload. A load test simulates multiple transactions or users interacting with the computer
at the same time and provides reports on response times and system behavior.
Run-Time Settings
Run-Time settings allow you to customize the way a Vuser script is executed. You configure the run-time settings from the Controller
or VuGen before running a scenario. You can view information about the Vuser groups and scripts that were run in each scenario, as
well as the run-time settings for each script in a scenario, in the Scenario Run-Time Settings dialog box.

Scenario
A scenario defines the events that occur during each testing session. For example, a scenario defines and controls the number of
users to emulate, the actions that they perform, and the machines on which they run their emulations
Scheduler Session
The Schedule Builder allows you to set the time that the scenario will start running, the duration time of the scenario or of the Vuser
groups within the scenario, and to gradually run and stop the Vusers within the scenario or within a Vuser group. It also allows you to
set the load behavior of Vusers in a scenario.
Session
When you work with the Analysis utility, you work within a session. An Analysis session contains at least one set of scenario results
(lrr file). The Analysis utility processes the scenario result information and generates graphs and reports. The Analysis stores the
display information and layout settings for the active graphs in a file with an .lra extension. Each session has a session name, result
file name, database name, directory path, and type.
Transactions
A transaction represents an action or a set of actions used to measure the performance of the server. You define transactions within
your Vuser script by enclosing the appropriate sections of the script with start and end transaction statement.
Vusers
Vusers or virtual users are used by LoadRunner as a replacement for human users. When you run a scenario, Vusers emulate the
actions of human users working with your application. A scenario can contain tens, hundreds, or even thousands of Vusers running
concurrently on a single workstation.

In the Load runner analysis , below terms you will find and here is what it is.

Graph Information:

Average
Average value of the graph measurement's
Hits
The number of HTTP requests made by Vusers to the Web server.
Maximum
Maximum value of the graph measurement's.
Measurement

This is the type of resource being monitored
Median
Middle value of the graph measurement's
Minimum
Minimum value of the graph measurement's.
Network Delay
The time it takes for a packet of data sent across the network to go to the requested node and return.
Network Path
The Network Path is the route data travels between the source machine and the destination machine.
Response time
The time taken to perform a transaction
Scale (or granularity)
In order to display all the measurements on a single graph, thus making the graphs easier to read and analyze, you can change the
scale or (granularity) of the x-axis. You can either set measurement scales manually, view measurement trends for all measurements
in the graph, or let Analysis scale them automatically. The Legend tab indicates the scale factor for each resource.

Standard Deviation (SD)
The square root of the arithmetic mean value of the squares of the deviations from the arithmetic mean.
Throughput
Throughput is measured in bytes and represents the amount of data that the Vusers received from the server
Vuser Load
When you run a scenario, the Vusers generate load or stress on the server. LoadRunner monitors the effect of this load on the
performance of your application

Hope this helps :) 

Tuesday, August 5, 2014

IP Spoofing in HP Load runner


About IP Spoofing:


In order to replicate real world scenario when you do performance tests , it is required to test by enabling IP spoofing.

Usually network routers and application servers identify the client requests by their IP address and it will get cached.

So Load runner LG's , when you test requests will be made from the same IP address ( assuming your test scenario have only one LG). So network routers and application servers will cache the requests for better throughput and which in term miss the real life situations. To overcome this HP load runner have this feature ( IP Spoofing ) to make fool the devices that requests are coming from different IP address.

So you setup the fake IP address from the LG machine and enable this feature in Controller.

How to setup IP Spoofing.

 1)        Run IP Wizard (Start > Program Files > Load Runner > Tools > IP Wizard) on LG machines  to add the static IPs that we want to emulate in scenario.
           how many static IPs ?(based on number of Vusers to be executed on tests, if we use 100 users for scenarios, than 100 static IP's).

2)         Update the Load balancer/web servers routing table with new static IPs, this is done so that servers are able trace back to the client. If client and server are in same network and subnet mask then no need of modification is required.

3)         Re-start the LG’s where static IP’s are set to make modifications effect.

4)          Enable IP Spoofing ( Scenario > Enable IP Spoofer ) from Controller, before connecting to LG

Hope this helps :)


Tuesday, July 8, 2014

DB File Sequential Read wait event is High on Oracle Database - Performance Engineering to Find out where is Bottleneck?

Found one interesting problem during performance testing , wanted to share here.

Observed there is a drop on server throughput, Correlated Load runner Throughput graph with Average Response time graph:

From the above Graph for the first 25mins ART was so high and that time throughput was low , after that both the graphs are stable.

So what happened on first 25mins of the load test , Lets go and do some analysis on server.

So we should start checking the servers ( web/app/DB ) to find out where is the problem , most likely throughput related issues occurs from DB side , lets start investigating from Data base server first.

Started checking with Database first and observed there is a high user I/O activity during high response time (low throughput).
So from OEM console, observed high user I/O.

So we can see the problematic SQL, which is making high User I/O.


So click on above SQL ID and see what event is making this high user I/O ( so by now at least we know which SQL is the culprit)


So above graph shows DB file sequential read event is more  , so get either AWR or ADDM report or Talk to DBA to know why this is so high?

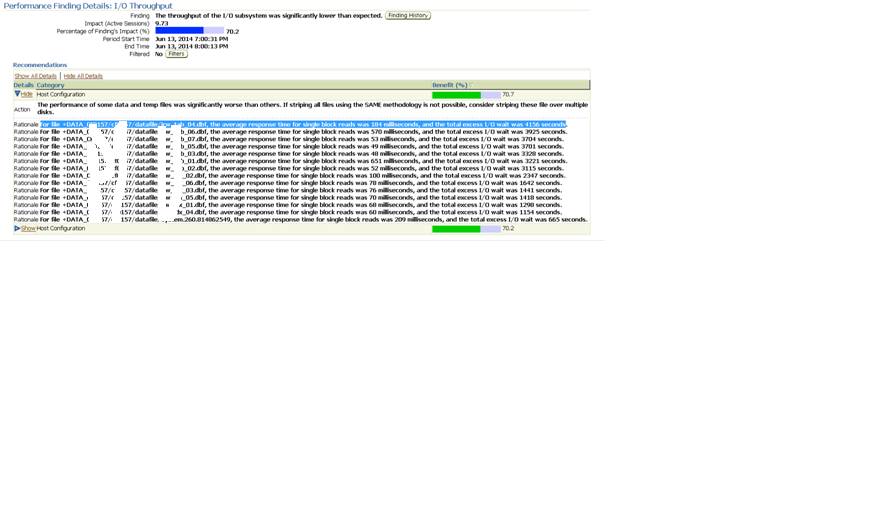
So when I generate ADDM report for Oracle recommendations below is what I got.

The performance of some data and temp files was significantly worse than others. If striping all files using the SAME methodology is not possible, consider striping these file over multiple disks.

For file +DATA_XXXXXXXX/datafile/XXXX_tab_04.dbf, the average response time for single block reads was 184 milliseconds, and the total excess I/O wait was 4156 seconds.

Below would the mitigations we can follow to overcome this issue:

DB File Sequential Read wait event occurs when we are trying to access data using index and oracle is waiting for the read of index block from disk to buffer cache to complete.  A sequential read is a single-block read.Single block I/Os are usually the result of using indexes. Rarely, full table scan calls could get truncated to a single block call due to extent boundaries, or buffers already present in the buffer cache.Db file sequential read wait events may also appear when undo blocks are read from disk in order to provide a consistent get(rarely).

To determine the actual object being waited can be checked by the p1, p2, p3 info in v$session_wait .  A sequential read is usually a single-block read, although it is possible to see sequential reads for more than one block (See P3). This wait may also be seen for reads from datafile headers (P2 indicates a file header read) ,where p1,p2 and p3 gives the the absolute file number ,the block being read ,and  the number of blocks (i.e, P3 should be 1) respectively. 

Block reads are fairly inevitable so the aim should be to minimise un-necessary IO. This is best achieved by good application design and efficient execution plans. Changes to execution plans can yield orders of magnitude changes in performance.Hence to reduce this wait event follow the below points .

1.)
 Tune Oracle - tuning SQL statements to reduce unnecessary I/O request is the only guaranteed way to reduce "db file sequential read" wait time.
2.)
 Tune Physical Devices - Distribute(stripe) the data on diferent disk to reduce the i/o . Logical distribution is useless. "Physical" I/O performance is only governed by "independency of devices".
3.)
 Faster Disk - Buy the faster disk to reduce the unnecessary I/O request .
4.)
 Increase db_block_buffers - A larger buffer cache can (not will, "might") help.


Hope This helps :) 


Get CPU utilization of Linux based machine using 

Vmstat.


Generally time stamp may not be available by default for vmstat command in Linux ( check if vmstat -t works ?).

Check the below command for monitoring CPU usage of your server with time stamp using vmstat.

vmstat 60 60 | awk '{now=strftime("%Y-%m-%d %T "); print now,100-$15}' >CPUUsage.txt

60 60 -> Every 60 secs, one sample will be taken and total 60 times reading will be taken
now -> variable where we are storing the time
print now -> Time Stamp will be printed along with vmstat output
$15 -> 15th Column output ( which is ID value on vmstat , idle time, so 100-idle time with give non-idle time of CPU).


if you want to copy the output to a separate text file using (  >CPUUsage.txt ) any file name.  so output will be available at CPUUsage.txt text file.

Output:

$ vmstat 60 60 | awk '{now=strftime("%Y-%m-%d %T "); print now,100-$15}'
2014-06-18 11:43:10  13
2014-06-18 11:43:10  10
2014-06-18 11:43:10  8
2014-06-18 11:44:10  12

So here first column is for time stamp and second column is for CPU utilization , take this values and draw a graph from XL :) happy learning.